Fact-checked by the Smart Insurance 101 editorial team
Quick Answer
Liability-only coverage pays for damage you cause to others; full coverage adds collision and comprehensive to protect your own vehicle. The breakeven point typically falls when your car is worth less than $4,000–$5,000 and the annual premium difference exceeds $1,200, making full coverage cost more over time than the car is worth.
The choice between liability only vs full coverage comes down to one question: is the cost of insuring your car against damage greater than the realistic financial risk of losing it? According to the National Association of Insurance Commissioners’ 2026 auto insurance database report, the national combined average premium per issued vehicle reached $1,438 in 2023, but the gap between liability-only and full coverage policies can run $1,200 or more annually depending on the vehicle and driver profile.
That gap is the number most drivers never actually write down. This guide walks through what each coverage type pays for, how to calculate the breakeven point for your specific car value, and the hidden risks that can make dropping to liability-only more expensive than it looks on paper.
Key Takeaways
- The national average full coverage premium runs roughly $2,200–$2,600 per year versus $800–$1,200 for liability-only, creating an annual gap that can equal 20–30% of a $5,000 car’s value (NAIC, 2026).
- The average auto liability claim for bodily injury reached $28,278 in 2024, meaning minimum-limit policies can leave drivers personally exposed in serious crashes (Insurance Information Institute, 2024).
- The average liability claim for property damage was $6,770 in 2024, often exceeding state minimum property damage limits of $10,000–$25,000 in multi-vehicle accidents (III, 2024).
- 33.4% of U.S. drivers were uninsured or underinsured in 2023, which affects the risk calculus for drivers carrying only liability coverage (Insurance Research Council, 2025).
- The Kansas Insurance Department recommends considering liability-only on vehicles valued at less than $3,000, a threshold that reflects the point where collision and comprehensive premiums rarely pay off (Kansas Insurance Department).
In This Guide
What Liability-Only and Full Coverage Actually Pay For
Liability-only coverage pays for injuries and property damage you cause to other people in an accident. It does not pay a cent toward repairing or replacing your own vehicle. Full coverage is not a formal insurance term, but in practice it refers to a policy that bundles liability with collision coverage (damage from crashes) and comprehensive coverage (theft, weather, fire, and animal strikes).
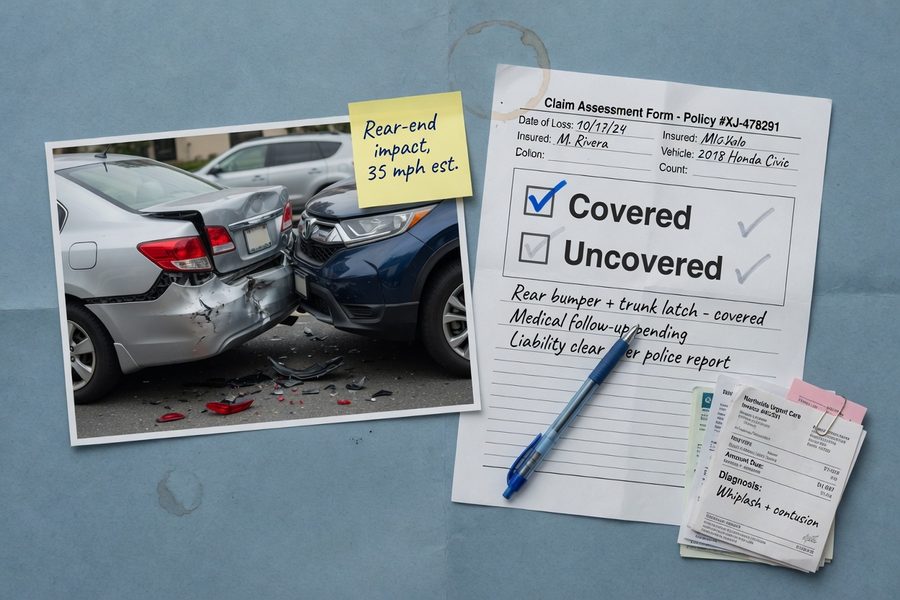
Covered vs. Uncovered Scenarios
The distinction matters most in the three situations drivers actually face. If you rear-end another car, liability pays for their repairs and medical bills. Collision coverage handles your car’s damage. If your vehicle is stolen or a hailstorm totals it, only comprehensive pays out. With liability-only, all three scenarios leave your own vehicle unprotected.
For a concrete illustration: a driver with liability-only who causes a $12,000 collision with another vehicle would have that cost covered. The same driver who skids off an icy road into a guardrail would receive nothing for their own repairs. As covered in our guide on everything you need to know about car insurance, these coverage gaps are where drivers are most often caught off guard.
Lenders and leasing companies layer another rule on top of this: if you finance or lease a vehicle, your contract almost certainly requires full coverage regardless of the car’s market value. Dropping to liability-only on a financed car violates the loan agreement and can trigger force-placed insurance, which is far more expensive than anything you would have chosen yourself. This is true whether your loan is through a large bank like Chase, a credit union, or a personal finance lender such as SoFi.
How Much More Does Full Coverage Cost?
The national average premium gap is substantial. Full coverage typically runs $2,200–$2,600 per year at the national level, while liability-only averages $800–$1,200, according to data tracked alongside the NAIC’s 2026 auto insurance database. That creates a baseline annual delta of roughly $1,000–$1,500 before factoring in your specific driver profile, ZIP code, or vehicle.
State-level variation is significant and often overlooked. Florida, Louisiana, and Michigan drivers face full coverage premiums that can exceed $3,500 per year, widening the gap considerably. In lower-cost states like Maine or Vermont, the difference may shrink to under $800 annually. The premium delta is driven by three main factors: the car’s actual cash value, the driver’s claims history, and the regional cost of parts and labor. Rising repair costs and persistent parts inflation since 2022 have pushed both sides of that equation higher, but the percentage increase has been steeper for collision claims on newer vehicles.
Your credit profile also affects the number. In most states, insurers use a credit-based insurance score, similar in structure to a FICO Score, to set premiums. Drivers with thin or damaged credit histories, which Experian defines as scores below 580, often face surcharges that widen the full-coverage premium gap further. The Federal Trade Commission has documented this link between credit data and insurance pricing, and several state insurance regulators have pushed for disclosure requirements around it.
The annual premium difference between full coverage and liability-only can reach $1,200–$1,500 nationally, an amount that equals 24–30% of a $5,000 car’s market value every single year you keep full coverage on it.
The Breakeven Math Most Drivers Skip
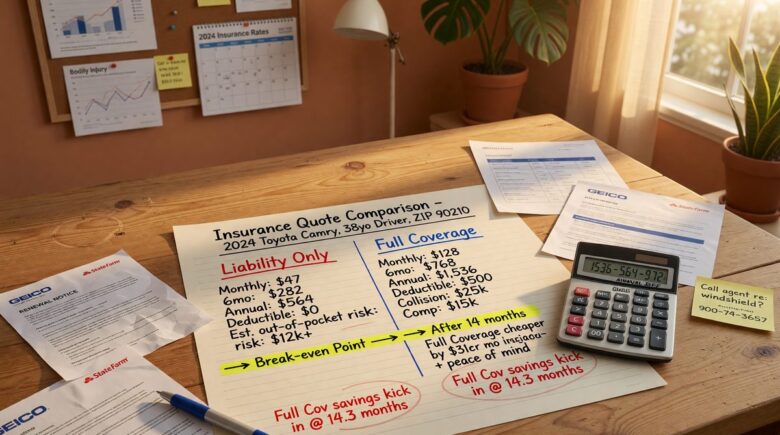
Three variables determine whether full coverage makes financial sense: the car’s current market value, the annual premium difference between coverage levels, and your deductible. The formula is straightforward once you lay it out.
The Breakeven Formula
Start with your car’s actual cash value (ACV), which is what the insurer would pay if the car were totaled. Subtract your deductible to get the maximum net payout you could ever receive from a collision or comprehensive claim. Then divide that number by the annual premium delta to find the breakeven period in years.
Example: Your car’s ACV is $6,000. Your deductible is $1,000. Your maximum net payout is $5,000. Full coverage costs $2,400 per year; liability-only costs $1,100. The annual delta is $1,300. Breakeven period: $5,000 / $1,300 = 3.85 years. If you keep the car without a total-loss claim for about four years, you will have spent more on full coverage premiums than you could ever collect.
Now account for claim probability. Drivers file an at-fault collision claim roughly 3–5% of any given year, according to industry actuarial patterns. That means in a four-year window, the odds of needing that collision payout are still below 20%. For a $6,000 car, the expected value of the collision coverage is approximately $5,000 × 0.04 = $200 per year, well below the $1,300 annual premium delta.
One honest caveat: this expected-value calculation assumes a single claim over the period. Drivers with a history of at-fault accidents, or those living in dense urban areas where fender-benders are frequent, face higher personal claim probabilities than the national average. The Insurance Information Institute notes that drivers in urban ZIP codes file collision claims at rates nearly double those in rural areas. If your situation fits that profile, the math shifts toward keeping full coverage longer than the formula alone would suggest.
A widely used insurance rule of thumb holds that when your annual collision and comprehensive premium exceeds 10% of your vehicle’s actual cash value, liability-only is almost always the lower long-term cost, assuming the car is paid off.
Applying This to Real Vehicle Values
For a $4,000 car with a $1,000 deductible, the maximum collision payout is $3,000. At a $1,200 annual delta, breakeven comes in just 2.5 years. For an $8,000 car with the same deductible and delta, breakeven stretches to 5.8 years, and the math starts to favor full coverage, especially if the car is in a high-theft area. Our article on car insurance quotes explained covers how vehicle value affects your quoted premium in more detail.
| Car ACV | Deductible | Max Net Payout | Annual Premium Delta | Breakeven (Years) |
|---|---|---|---|---|
| $3,000 | $500 | $2,500 | $1,200 | 2.1 |
| $5,000 | $1,000 | $4,000 | $1,300 | 3.1 |
| $6,000 | $1,000 | $5,000 | $1,300 | 3.8 |
| $8,000 | $1,000 | $7,000 | $1,200 | 5.8 |
| $12,000 | $1,000 | $11,000 | $1,400 | 7.9 |
When Liability-Only Makes Financial Sense
Four conditions together make liability-only the defensible financial choice: the car is paid off, its ACV is below $5,000, you have a cash emergency fund large enough to replace or repair it, and your driving record does not include recent at-fault claims.
Vehicle Value and the $3,000–$5,000 Threshold
The Kansas Insurance Department’s Auto Insurance Shopper’s Guide states that drivers should consider liability-only coverage on motor vehicles valued less than $3,000, because collision and comprehensive premiums on such vehicles rarely pay off over time. Most financial planners extend that threshold to $4,000–$5,000 given current repair costs, particularly in states where the NAIC reports above-average combined loss ratios.
The self-insurance requirement is non-negotiable. Dropping collision coverage without a cash buffer to replace the car simply shifts the risk onto your own cash flow. If losing the car to a crash or theft would force you into debt, the math changes entirely. You need savings that cover the car’s full replacement cost, not just the deductible. Personal finance platforms like SoFi and tools from Experian’s financial planning division often recommend keeping three to six months of essential expenses, including transportation, as a prerequisite before making any coverage reduction.
Location also matters. Drivers in high-theft cities, hail-prone plains states, or areas with frequent flooding face elevated comprehensive risk that can make full coverage worthwhile even on older vehicles. If your ZIP code sees frequent catalytic converter thefts or regular hailstorms, discount the liability-only option accordingly. You can read more about how location and risk profiles affect premiums in our piece on why insurance premiums are rising.

Hidden Risks of Dropping to Liability-Only
The financial case for liability-only looks clean on a spreadsheet but gets complicated fast when liability claims exceed your policy limits or when repair costs diverge from market values.
Minimum Limits and Personal Asset Exposure
Most state minimum liability limits are dangerously low relative to actual claim costs. The average bodily injury liability claim reached $28,278 in 2024, per the Insurance Information Institute’s 2024 data. Many states set minimum bodily injury limits at $25,000 per person, meaning a single serious injury claim can exceed your coverage and expose your personal assets to a judgment. Property damage claims averaged $6,770 that same year, but multi-vehicle accidents can multiply that figure quickly.
State insurance regulators, including the California Department of Insurance and the New York Department of Financial Services, have separately noted that minimum-limit policies leave a growing share of drivers underinsured relative to actual settlement values. Drivers who own real property or carry significant savings, assets visible to plaintiffs’ attorneys through public records, face real judgment risk from a serious at-fault accident on a thin liability policy.
The uninsured driver problem compounds this exposure. Insurance Research Council data from 2025 shows that 15.4% of U.S. drivers were completely uninsured in 2023 and a total of 33.4% were either uninsured or underinsured. A driver carrying only liability coverage who is hit by an uninsured motorist has no collision coverage to fall back on for their own vehicle damage. Adding uninsured motorist property damage (UMPD) coverage to a liability-only policy is one way to close that specific gap without paying for full collision coverage. You can find more on liability exposures in our guide on why liability lawsuits are getting more expensive.
Repair Cost Inflation in 2026
Parts inflation since 2022 has raised average repair costs significantly. A collision that would have cost $4,500 to repair in 2020 routinely costs $6,500–$7,500 in 2026, driven by semiconductor shortages, labor rate increases, and the complexity of modern safety systems. The Bureau of Labor Statistics motor vehicle repair index has tracked this trend consistently since 2021, and it remains well above general CPI inflation.
This inflation cuts two ways. It increases the value of collision coverage on mid-range vehicles, but it also pushes older vehicles to total-loss status faster, reducing the net payout. A $7,000 repair estimate on an $8,000 ACV car results in a total loss declaration, and your payout is $8,000 minus your deductible, not the repair cost. Understanding how insurers calculate actual cash value, a process that references databases like CCC Intelligent Solutions and Mitchell International, the two dominant vehicle valuation platforms used by most U.S. carriers, is critical before dropping collision coverage. For a broader look at how coverage decisions interact across insurance types, our overview of types of insurance and their benefits provides useful context.
Before dropping to liability-only, get your car’s actual cash value from two sources: the Kelley Blue Book private-party value and your insurer’s own estimate. The insurer’s ACV determines your real payout, and it can run 10–15% below KBB, which directly affects your breakeven calculation.
Frequently Asked Questions
What is the main difference between liability-only and full coverage car insurance?
Liability-only pays for damages and injuries you cause to others; full coverage adds collision and comprehensive to pay for damage to your own vehicle. The practical difference is whether your insurer helps you repair or replace your car after a crash, theft, or weather event, regardless of who is at fault.
At what car value should I drop to liability-only?
Most financial analysts and state insurance agencies point to a vehicle ACV of $3,000–$5,000 as the threshold worth evaluating. The Kansas Insurance Department specifically recommends considering liability-only under $3,000. A more precise answer requires running the breakeven formula with your own premium quotes, deductible, and vehicle value, since location and driver profile shift the math significantly.
Does dropping to liability-only cover me if an uninsured driver hits me?
No, not unless you add separate uninsured motorist property damage (UMPD) coverage. With liability-only, if an uninsured driver totals your car and cannot pay, you have no coverage for your own vehicle repair costs. Given that one in three U.S. drivers was uninsured or underinsured in 2023, this gap is worth addressing even on older vehicles.
Can I switch to liability-only if I still have a car loan?
No. Lenders, whether a major bank like Chase, a credit union, or an online lender like SoFi, require full coverage as a condition of financing, and dropping below that level violates your loan agreement. The lender can legally place force-placed insurance on the vehicle at your expense, which typically costs far more than a standard full coverage policy.
How often should I recalculate whether full coverage is worth it?
Annually is the right cadence, or whenever you pay off a loan, after a significant birthday or change in driving record, or any time your car’s ACV drops by more than $1,000. Vehicle values depreciate unevenly, and the premium-to-value ratio that justified full coverage two years ago may no longer hold. Checking your credit-based insurance score through Experian or your current insurer before shopping can also reveal whether a improved FICO Score has made you eligible for lower full-coverage rates, which changes the breakeven calculation. Our step-by-step guide to car insurance quote comparison can help you gather the numbers you need for this annual review.
Sources
- National Association of Insurance Commissioners (NAIC), 2022/2023 Auto Insurance Database Report
- Insurance Information Institute (III), Facts and Statistics: Auto Insurance (2024)
- Insurance Research Council (IRC), One in Three Drivers Are Either Uninsured or Underinsured in the U.S. (2025)
- Kansas Insurance Department, Auto Insurance Shopper’s Guide
- Insurance Information Institute, What Is Covered by Collision and Comprehensive Auto Insurance?
- NAIC, Consumer Alert: Auto Insurance Basics
- Insurance Information Institute, How Much Auto Coverage Do I Need?
- Insurance Information Institute, Background on Uninsured Motorists